Telenor’s corporate responsibility report
ENERGY CONSUMPTION
0
5000
10000
15000
20000
25000
30000
35000
40000
45000
50000
2012
2013
2014
t CO2 eq
Disel Generators
Disel - Heating
Warehouse - Natural gas
Refrigirants
Backbone Network - Electricity
BTS - Electricity
Offices - Electricity
Offices - Heating
Shops - Electricity
Fleet
Shops - Heating
Warehouse - Electricity
Flifgts
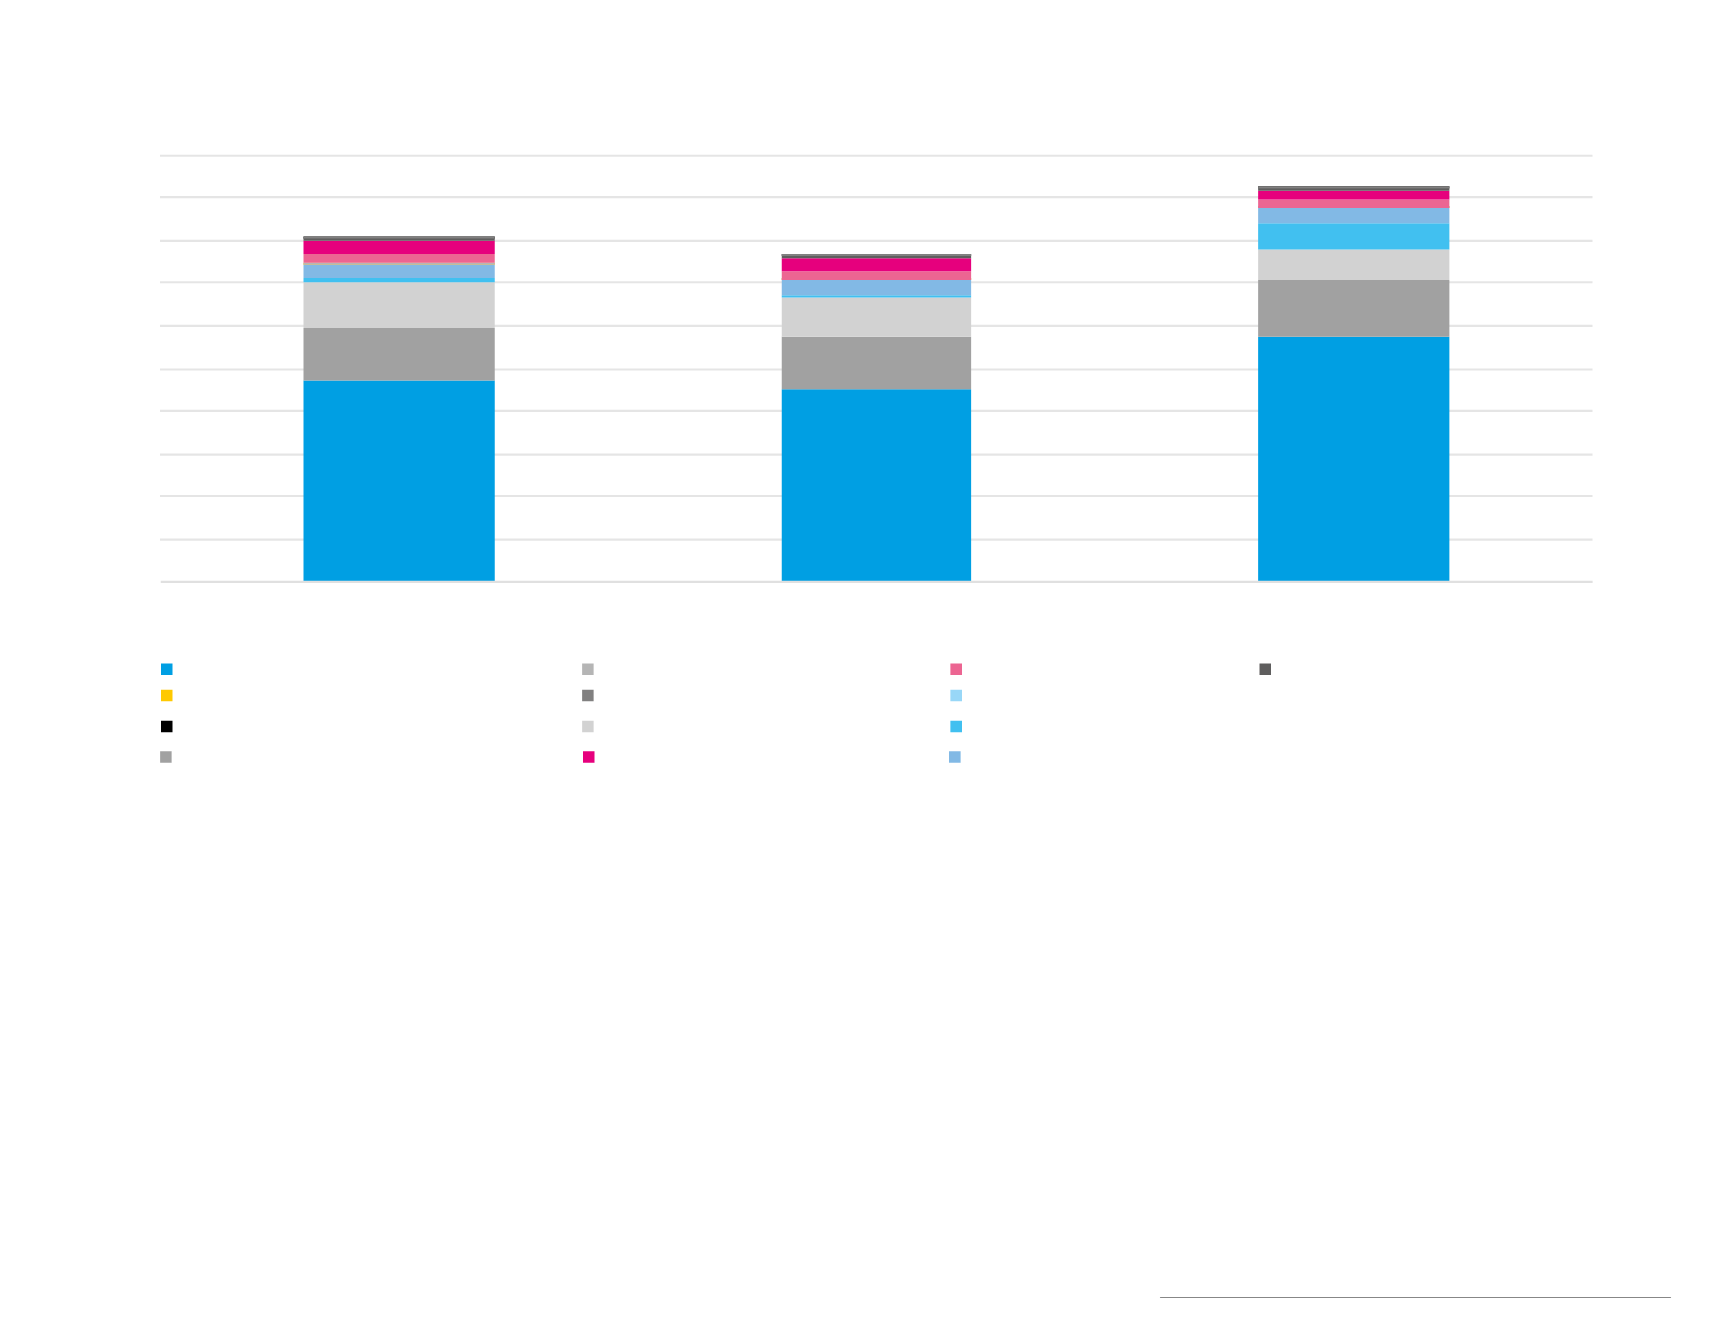
Fig. 7 Total CO2 emissions, 2012, 2013 и 2014
In 2014 the consumption of electricity in the
company offices decreased by 9% compared
to 2013 due to the new air conditioning system
introduced at headquarters, due to the re-
placement of desktop computers with laptops
for a large number of employees, as well as
due to the new teleworking practice. We have
21 % less electricity consumed within our retail
network compared to 2013, due to the optimi-
zation following the merger of GLOBUL & GER-
MANOS retail chains.
The electricity used in our network in 2014 is by
almost 22%more compared to 2013 due to the
46 % rise in data traffic, due to the expansion
of our network with additional 3G base stations
(by approximately 50%), and due to a paral-
lel functioning of systems during our network
renovation. On the bright side, at our off-grid
base stations we used approximately 30 000
liters of diesel less than in 2013. This is due
to the decreased need to use back-up diesel
Environment
46
generators, which we turn to during regional
power outages. Moreover, the hybrid systems
with batteries and solar panels, further con-
tribute to a decrease in the fuel consumption
in our network. Our investment in photovoltaic
panels saves around 30% of the diesel fuels
needed in our diesel-battery hybrid base sta-
tions and approximately 60% of the fuel need-
ed for a base station running only on diesel.


