Telenor’s corporate responsibility report
OTHER EMISSIONS
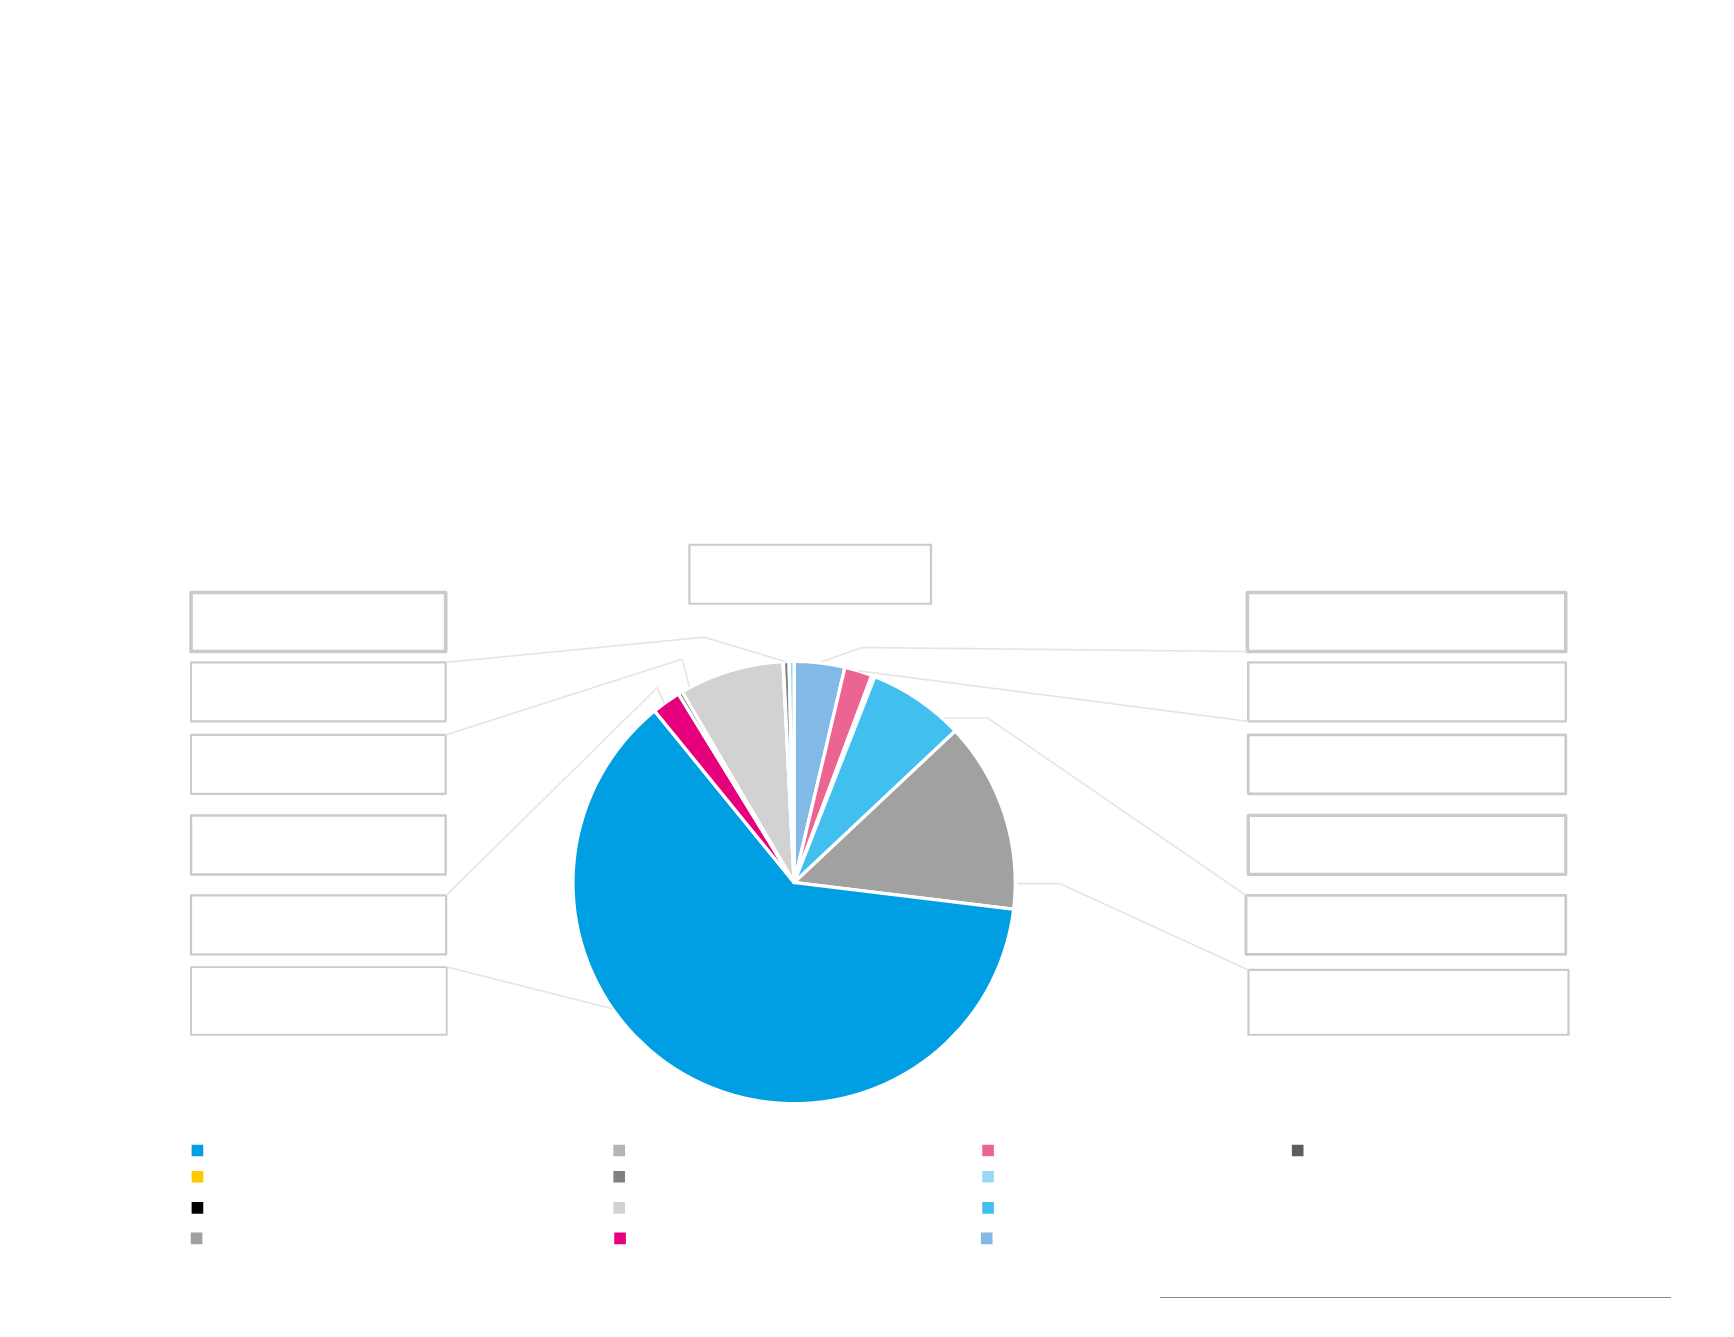
Europe and Asia. On fig.6 you can see the pre-
cise distribution of emission sources within the
company. In 2014 we had increase in GHG
emissions by 20.6% compared to 2013. There
were two main reasons for that: refrigerants,
due to changes in our air conditioning sys-
tems; and the higher electricity emission fac-
tor for Bulgaria in 2014. In 2015 we expect low-
er energy consumption due to the introduction
of equipment with higher energy efficiency, as
part of our network renovation project.
станции
Disel Generators
Disel Generators
2%
Disel - Heating
Disel - Heating
0.02 %
Warehouse - Natural gas
Warehouse - Natural gas
0.1 %
Refrigirants
Refrigirants
7%
Backbone Network - Electricity
Backbone Network - Electricity
14%
BTS - Electricity
BTS - Electricity
62%
Offices - Electricity
Offices - Electricity
-
2%
Offices - Heating
Offices - Heating
0.02 %
Shops - Electricity
Shops - Electricity
8%
Fleet
Fleet
4%
Shops - Heating
Shops - Heating
0.3 %
Warehouse - Electricity
Warehouse - Electricity
1%
Flifgts
Flifgts
0.4 %
Fig. 6 CO2 emissions by source, 2014
Environment
45
We also monitor emissions generated through
the business flights of our employees (Level 3).
In 2014 company employees travelled approx-
imately 114,000 km more compared to 2013,
which results in 9% growth in GHGs. This busi-
ness need is a result of the specifics of Telenor
Group, which has operations in 13 countries in


